Because of some pretty badass data science and Google’s ever-increasing awesomeness, it looks like one day in the not-too-distant future, we will all be able to get a free (or heavily-discounted) ride. A taxi ride, that is.

What’s the catch?.?. Well, the deal is … based on your location you’d receive an offer on your smartphone. The offer advertisement would likely be for a discount on goods or services from a local brick-and-mortar business. If you are interested in going to that part of town, then you can get a free (or discounted) ride. In order to keep people from abusing the free-ride offer, your ride-to-purchase ratio would be accounted for in your Google profile. And if you’re a ride-bum, you probably won’t get too many future offers for the free-ride.
This system isn’t just some sci-fi junky’s greatest fantasy… It’s on its way to becoming reality. Google was awarded a patent for this transportation-aware physical advertising conversions system back in January of 2014.
There are tons of advanced data science that goes into a system design like this one. While I can’t cover all of the algorithms that a system like this utilizes… I’d like to discuss a powerful location-based algorithm that can be used to design systems similar to that recently patented by Google.
What is a Location-Based Algorithm?
Quietly, behind the scenes, location-based social networking (LBSN) has been stopping the show when it comes to location-based intelligence and advanced mobile marketing. These networks have been recording and analyzing user preferences, user social influence, and user location. Its purpose? That is in order to power personalized, geo-social recommendation engines that can be used to deliver mobile advertisements. Although this practice isn’t brand new, improvements are continually being made.
Recently, Dr. Jia-Dong Zhang has been working out a way to drastically improve location recommendation performance by using a “kernel density estimation approach to personalize the geographical influence on users’ check-in behaviors as individual distributions rather than a universal distribution for all users.”
What is Kernel Density Estimation?
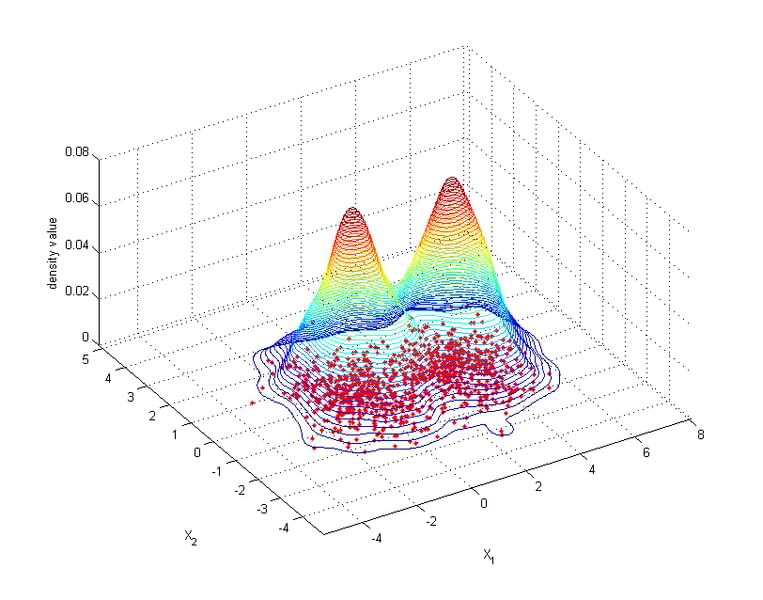
If you’re not already familiar with it, kernel density estimation (KDE) is a non-parametric estimation method. It can be used to calculate the probability density function of a random variable or set of variables. In spatial terms, KDE uses a kernel function to estimate a smooth tapered surface that represents clustering and density patterns of points or lines in space.
Figure 1 Kernel density estimate with diagonal bandwidth for synthetic normal mixture data
KDE is a popular method for quantifying the intensity and density of a point pattern. In other words, “hot spot” analyses. KDE is quite useful for modeling and predicting spatio-temporal trends. Trends specifically related to interest areas like market area analysis, environmental pollution, crime, disease outbreak, and seismic risk. Since the method employs a kernel function to estimate density, there are less boundary effects than those exhibited by counting methods. KDE can be performed using R (‘ks’), Python(‘scipy’), ArcGIS (Spatial Analyst), and QGIS (heatmap plugin).


